Posts from the ‘The Journey’ Category

As the alarm of the fire drill blared loudly, the pre-kindergarten students remained silent and still. “They’ve always cried and become dysregulated during fire drills” explained a 2nd grade teacher at Personalized Learning Prep at Sam Houston, a PK-5th public school in Dallas. Describing their return to in-person learning, “our students were quieter and afraid now, you can see it.”
I heard this story last week during a Clubhouse chat that I’ve been co-hosting with Jin-Soo (@JinsooDHuh). We’ve been hosting bi-weekly chats centered on the voices of educators who are leading in-person instruction because their voices have been hard to hear above the cacophonous political debate over the return to in-person.
As someone who is supporting the reopening of 4 elementary schools, I felt a mild sense of panic when I heard this story of the fire alarm. I am not assuming that these pre-k students were emotionally disassociated. The fact is that their silence may be a sign of resilience rather than detachment. What I am concerned about is whether all teachers would know to be curious about this atypical silence. If they are curious, would they have strategies for lifting student voices? If they knew how to lift student voice, would they know how to effectively respond to what they hear?
Parents and educators have developed incredible resources for responding to young children when they cry and throw tantrums; these behaviors literally demand our attention and response. While less noticeable, detachment and withdrawal are no less important to take note of and respond to. It is a scientific fact that students become increasingly capable of complex skills through the integration of their cognitive, social, and emotional development. If students are detached from their emotions then they are at serious risk of being unable to meaningfully retain the information they appear to be learning. If students do not feel physically or emotionally safe, they will not be set up to learn. So how are schools supporting teachers with identifying issues when the behavioral signals may be more quieter than ever? How are schools proactively assessing students’ emotional experiences?
At KIPP Public Schools Northern California, Alexei Greig, Director of School Culture, and Jazmin Lavezzo, Associate Director of School Culture, partnered with Turnaround for Children to develop practices and structures that could be used throughout the year to assess and ensure student’s emotional wellbeing. Towards this end, Alexei and Jazmin defined a clear theory of action: “if we elevate student voices, and engage with curiosity, we will be able to better connect with our students and support their well being.” Their theory catalyzed them to gather information that could enable teachers to better support students with developing healthy relationships (connectedness) and relationship skills (self management, social awareness, etc.).
Alexei and Jazmin wanted to leverage Turnaround for Children’s Whole-Child Inventories (WCI), which are a suite of measurement tools designed to prompt reflection and support a long-term coordinated approach to intentionally develop practices that create supportive settings with deep learning experiences and relationships. The Student WCI is comprised of 10 core practice areas and 36 indicators (example: My school cares about my growth as a person, not just my grades). They decided to use these indicators to gain actionable data on students’ experience every 2-3 weeks.
While Turnaround’s Student WCI is best-in-class when it comes to gathering information needed to better support students in developing healthy relationships and relationship skills (self management, social awareness, etc.), it is not a survey tool and would not enable them to either administer the survey to students every 2-3 weeks or analyze the results. They partnered with Naomi Wiener from the regional data team to review survey tools and ultimately chose Kelvin because it best met their criteria for success:
- For students, the survey is accessible and easy to complete
- For teachers who support students SEL, survey reports and emails provide results with clear highlights to celebrate and spotlights to act on along with operational recommendations tied to existing SEL curriculum (e.g. Turnarounnd for Children, Teaching Tolerance, PERTS, CORE).
- For school leaders who create and lead the culture of schools, surveys are easily and efficiently customizable to match culture goals and allow reports to be seen at the school level for coaching and support.
- For regional school culture team that ensures schools have full support in developing exemplary culture, survey comes with research backed questions and practices and can be adapted to regional culture goals.
- For regional data team who owns survey technology, survey is the all in one platform for survey delivery, reporting, and operationalization with syncs to our systems and many options for data integrations.
With Kelvin, students can take the survey on any device with google chrome (Kelvin plug-in already installed on all chromebooks). During the survey window, Karl the dog will appear in the lower right corner of the student’s browser window to remind them to complete the survey. Alternatively, students can access the survey at anytime by selecting the plug-in icon in the upper right corner of their browser.

Having selected the survey platform, they then needed to create the school-level protocol that would ensure there is follow through in responding to the data. The school culture team designed a survey response cycle that aligned with existing structures for other school-level data analysis. Immediately after the school pulse survey window closes, teachers and admin receive an email with survey results that are tailored to the audience (e.g. teachers see only see results of the students they teach). Once they have these results, they independently conduct a protocol to review the results. This protocol includes the following questions:
- What was the participation rate?
- What does the participation rate suggest about student investment?
- What do you want to celebrate and maintain?
- What do you want focus and act on?
- Are perceptions different between different subgroups?
- What recent events, conditions, or practices may have influenced these responses?
- What are some initial ideas you have about next steps that you want to share with your coach or Grade-Level Team?
- Are there students whose sentiment fell between pulses or is generally low?
Teachers meet weekly in grade-level team (GLT) meetings. Jazmin and Alexei designed a protocol for these teams to use to collectively review and respond to survey results and At the meeting, grade-level teams follow a protocol to analyze the data and develop a response.
Suggested Protocol
- Grade Level Teams (GLTs) review data to identify major trends across the grade level. Teams identify whether there are specific subgroups that seem to be having a disproportionately negative experience (e.g. Students w/ IEPS, Latino boys, etc.)
- (Optional) GLTs determine whether additional information is needed to identify root causes. If the team aligns on which teachers will check-in with groups of students to gather additional info (i.e. Get a sampling of feedback from the affected student groups)
- GLTs align on 1-2 actions they will take collectively during advisory or regular classes to address the areas of concern highlighted by the data.
- Teams implement the agreed upon actions over the next 2 weeks. Discuss progress based on observation in bi-weekly meetings until the next pulse on the same domain can give quantitative data to measure progress.

This kind of protocol requires coordination across grade-level teams, which can often hinder implementation. Kelvin’s platform anticipated this challenge by building in features to assist with coordinating responses and tracking follow up.

Given the frequency of these surveys, the response to one survey will be implemented when the next survey window opens.

Jazmin, Alexei and Naomi have leveraged world class systems and resources to create a system that not only seeks to understand how students are experiencing school but also provides teachers and leaders with the skills and resources they need to adjust that experience so that students can feel supported and thrive.
Even if your school doesn’t have capacity to establish the enabling systems described above, it should consider what an MVP might look like. In this case, Kelvin Education’s Student Wellness Platform makes it easy for teachers to review resources that can help them respond to survey data–They literally send it to your inbox and align it with the results. If your district has SEL resources that it already uses, you can customize the contents of the Kelvin resource library to ensure the emails link directly to the resources that are aligned to the survey items and results.

Traditionally, our attention has been given to the students who are disruptive. Now, perhaps more than ever, we need to be implementing systems proactively seek to understand how every student is feeling. We need to create systems that lift student voices and empower teachers to respond to what they hear.

In the last year, we have experienced our world falling apart. Many of us experienced new forms of anxiety and overwhelm that can only come from a threat that lingers for this long. Those of us who were lucky enough to continue working remotely also learned a cruel new sensation that arises when we force ourselves to login and show up online while in a state of intense anxiety or overwhelm. Some nights last spring, my anxiety would increase to the the precipice of agitation as I looked at my calendar and realized how few hours I had left before I was expected to be back on zoom. Looking at my calendar, I found myself thinking back to classroom observations where I’d witnessed students throw tantrums when they were asked to login at the chromebook station. I was comforted by the words of Kentaro Toyama who noted that ‘What people get out of technology depends on what they can do and want to do even without technology.’
While I will always be excited by the opportunities for technology to help enable every student to thrive, I’ve known for years that every ounce of technology requires ten ounces of humanity to make it effective in a classroom setting. During the 2018-19 school year, I shifted my focus to supporting a 5 year plan aimed at improving the experiences and outcomes of our most underserved students. I knew back then that it would be just as important to share what we were learning even when the strategies didn’t involve hardware. In the coming weeks, I will be resuming my regular dispatches on this blog and sharing overviews of promising practices and resources from this initiative as well as the work I’m doing to develop scalable systems for re-opening schools. Some of these reviews and posts will be about online resources like Reconstruction and others will be about resources that don’t require an internet connection. I’m in love with the problem I’m trying to solve and exploring solutions that can genuinely solve it. What’s more, I’m looking forward to the opportunity to continue sharing my observations here.

![]() Praise For KIPP Bay Area Teachers
Praise For KIPP Bay Area Teachers
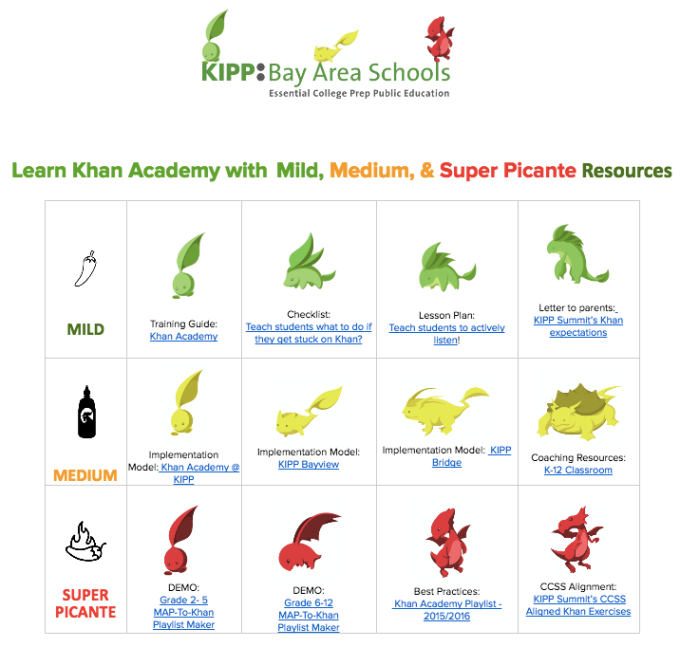
Last week, teachers from KIPP Bay Area Schools were recognized in an Edsurge article titled: “When Teachers Build Edtech, Awesomeness Ensues—and Here’s Why”. Written by Alex Hernandez, the column’s message is that students win when teachers are the ones building ed tech, and it features some great quotes, tools, and data from KIPP Bay Area classrooms.
KIPP Bay Area School’s Innovation team *loves* to share what we’ve learned. Below is a link to the mild, medium, and super picante resource page we created for our teachers last year. This page includes links to the playlist tool for 2nd-5th grade and 6th-12th grade.
![]() A Final Note #ItGetsBetter
A Final Note #ItGetsBetter
We’re thrilled and grateful for the recognition, and want to note that work is currently being done to further develop our tool into a world-class feature. In the meantime, we’re excited to share the resources for others looking to further personalize their instruction.
Footnote:
*”Productive innovation depends on two factors: (1) an organization’s capacity for efficiently replacing innovation uncertainty with knowledge, and (2) its ability to scale up innovation outcomes by enhancing its organizational effectiveness. Innovation and scaling thus work together to form an overall social impact creation process.” <https://ssir.org/articles/entry/when_innovation_goes_wrong>

Problem of Practice: How can we use interim assessment* data to better provide teachers and students with personalized learning resources?
Practical Solution: At this year’s Data Champion Summit, I presented a case study to show one way we answered the question above. Ultimately, I hoped to expand the ways we use data, and address not only the question of “what works?” but also “how can we improve the way we work it?”

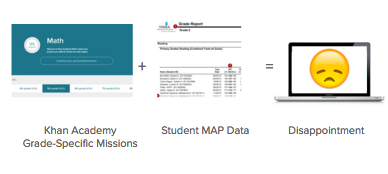
We have to use data to meet students where they are and improve our use of adaptive online resources so we can reach higher, faster and better than ever before. Here’s an example of the data we started with; it comes from the MAP assessments we administer in the fall

Even when visualized, the data from the example MAP report above wasn’t much better. At best, it told teachers something they already knew and at worst it misled teachers who might assume that top quartile students were at grade level when they may be 1-3 grade levels above.


Khan Academy has great missions that are adaptive but also grade-level specific and not optimal for the reality of the fifth grade math class that has students ready ready for 1st grade, 9th grade and every grade in between.
Last fall, Khan Academy and NWEA published a PDF that changed everything. This document correlates MAP® sub-goals and RIT ranges to Khan Academy® exercises. It provided us with a kind of route map and potentially help a teacher or student better tailor the instruction to ensure the student got from where they were to where they should be by the end of the academic year. Like a route map, this PDF gave us the means to “see” the routes students could take from where they were to where we wanted them to be. This was really, really helpful. Before then, we would rely on grade-level missions to provide students with “appropriate” exercises. These problems, however, were not tailored to what students began the year knowing how to do. Instead, the aligned to the standards that students are expected to cover over the course of 5th grade.

A MAP score report had no way of “speaking” to the PDF of suggested Khan Academy exercises. While these were the means for creating personalized playlists, using them to do so for 100+ students was impossible. Even with unconditional hope, a teacher trying to use these resources to create personalized playlists doesn’t have unlimited time. In fact, they may only have 60 minutes of prep time each day, so I saw it as my responsibility to automate the process of creating personalized KA playlists.
Using the Data to Work it
Here’s how teachers use the tool we made.
Step 1. highlight & copy data from MAP score report
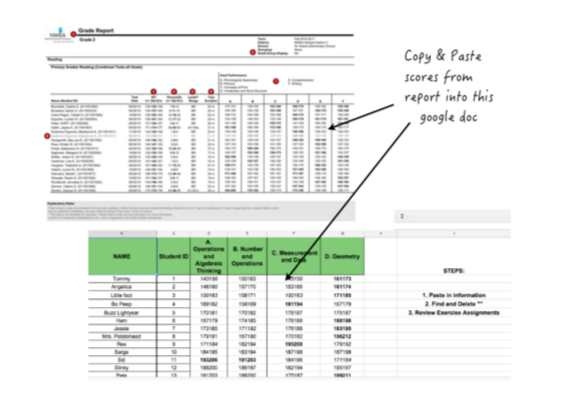
Step 2. Paste data into tool we made & review auto-generated playlists for each student. Students names are highlighted to indicate the exercises they should begin with. All students begin with exercises that match their assigned color.


The first feedback we received was that it was amazing to see the grade level that students were ready for. This was a highly unanticipated benefit. Since Khan exercises are tied to standards and each standard is grade-specific we were able to easily translate MAP scores into grade-level equivalency** teachers could more easily see the grade level that students were ready to learn at. This playlist tool literally gave teachers a better picture of their students’ proficiency and a clearer sense of the fact that teaching fifth grade math and teaching math to fifth graders are not the same thing.

Data driven improvement =
evaluating what works + improving how we “work” it


* 3 big types of assessments:
- Summative: Tests used for end-of-year accountability and evaluation
- Formative: Educator resources that support measuring student learning in real-time during instruction
- Interim: Tests used for timely and periodic information based on local needs/goals
**Grade Equivalent scores range from K-12. They represent how a student’s test performance compares with that of other students nationally. For example, if a 5th-grade student has a GE of 7, the student’s score is equal to that of a typical 7th grader.
When it comes to adaptive learning resources, we should turn our focus from how they change. in response to student learning to how they change the student’s learning trajectory.
For students in grades 3-9, we use data from adaptive assessments to predict their 12th grade ACT scores. This helps us ensure they are on the path to and through college…


While our data team helps schools to use adaptive assessments to make predictions

my team, the innovation team, uses adaptive resources to break them…
There are several ways that we use adaptive assessment data to inform and improve adaptive content…

We used data from adaptive assessments to ask “What works?” and discover how our students and teachers worked it…We use adaptive assessment data to go beyond fidelity of use and define excellence in use to ensure all learners optimally leverage adaptive content. Most recently, we began using knowledge of adaptive content to designed a tool that could inform use of online content school-wide instructional design

“For every ounce of technology, you need 10 ounces of humanity.” ~ me
These we’re some of the advice I shared at last week’s SF EDTech Meetup, which was focused on adaptive learning. The link below goes to podcast of the ignite talks that I and six others gave.
Podcast
For every ounce of technology, you’ll need 10 ounces of humanity. ~Me
The students entering our classrooms come from more diverse backgrounds and bring a wider set of needs and abilities than ever in history. At KIPP Bay Area Schools, we use assessment data to help us determine what our students know and what they are ready to learn. 
Being a 5th grader, doesn’t mean you are ready to learn 5th grade math. The graphics below show the reality of trying to teach 5th grade math. On the left, you’ll see a graphic that shows the grade level they are ready to learn. On the right, is shows what will happen when you teach fifth grade math to the entire class-many will be underprepared, some will be ready and the rest will be very bored.

These graphics could represent a majority of our nation’s 5th grade classrooms, and illustrate a universal truth:
Planning to teach 5th grade math, and preparing to teach the 5th graders in your math class are not the same thing.
Planning to teach 5th grade math is like running a 5k… You do your best to stay on the path and at an optimal pace. Preparing to teacher every student in your 5th grade math class is like running a Tough Mudder.
The Promise of #MyData
On January 15th, the government announced a Request for Ideas (RFI) for a new FAFSA. The next iteration of the Federal Financial Aid Application could be an app that’s essentially Turbo Tax for filing financial aid to ensure that students get the maximum financial aid offer and help make sure there are no mistakes nor missed deadlines. The My Data initiative recognizes that schools, companies, and government agencies have databases containing the information a student needs to populate the blank spaces in a financial application form.
Facts
The number of students failing to file the FAFSA each year has remained flat for over a decade. Of the students who did not apply for financial aid from any source, almost all (95.3%) gave at least one of five reasons for not applying: thought ineligible (60.7%), no financial need (50.6%), did not want to take on the debt (40.2%), no information on how to apply (22.9%) and forms were too much work (18.9%). The first three reasons accounted for 92.2% of the non-applicants. Many of these students, however, would have qualified for financial aid. About a third of these students, for example, would have qualified for a Pell Grant and about a sixth for a full Pell Grant. At least 1.7 million students fail to file the FAFSA each year because they incorrectly believe themselves to be ineligible.
Moral Imperative
Currently, our financial aid application process is shameful injustice. We as a society are morally obligated recognize that students have a right to their data. Furthermore, they have the right to give others permission to use the information to automatically calculate or update their financial aid offer. I have seen how my students’ information is automatically used to notify them of their obligation to register for the draft, but I have longed to see it used to notify them of their financial aid eligibility.
Motivational focus affects how we approach life’s challenges and demands. While everyone is concerned at various times with both promotion and prevention, most of us have a dominant motivational focus, which affects what we pay attention to, what we value and how we feel when we succeed or fail. As educators, we have the pleasure of working with prevention and promotion-focused students, and those who successfully speak the motivational language of both have shown remarkable results. (1)
While the classroom management style prescribed in Doug Lemov’s Teach like a Champ is highly suitable for prevention-focused pupils, the promotion-focused will thrive when teachers have management styles that support creative solutions, long-term visions, and opportunities to shake things up. (2)
Dream Deserts
Many of my students had jobs and most of their parents had more than one. Those jobs, however, are insufficient means for providing promotion-focused students with inspiration. To clarify, a job and a career are not the same. A career is defined by the OED as an individual’s “course or progress through life.” The etymology of the term comes from the 16th century French word Carriere, which meant “road” or “racecourse.” In contrast, a job is “a regular activity performed in exchange for payment.” If you still don’t see the distinction, Chris Rock can elucidate further.
Some don’t have to leave the kitchen table to see people with fulfilling careers, these privileged individuals were not the students I worked with. Along the bus-ride or walk home from school each day, my students saw insufficient examples of successful careers. Regardless of their motivational focus, people will always dream about their future. But those dreams, and the will to realize them is limited in “dream deserts” where access and opportunity are unjustly stifled. (3)
“Have a Dream I said” – The language promotion-focused students need to hear
Lacking sufficient examples of career opportunities in the formal economy, my students were often vocal about their motivations to enter the informal economy. I took their insights seriously, and created an entire unit to address them. This unit began with an excerpt from Jay-Z’s Decoded titled “Have a Dream I Said”. It began with the a simple question: What’s the basic motivation for a hustler?
The kid in McDonald’s gets a check and that’s it. There’s no dream in fast food. Manager? That’s a promotion, not a dream…The truth is that most kids on the corner aren’t making big money–especially if you break their income down to an hourly wage. (footnote from freakonomics) But they’re getting rewarded in ways that go beyond dollars and cents. The kid on the streets is getting a shot at a dream.
This vignette spoke of my promotion-focused students’ profound capacity to channel their energy towards a compelling victory. Moreover, it undermined mythologies of the informal economy. As teachers, we must speak the language of promotion-focused students daily. We must provide them with more vivid, inspirational examples of success and a map that will lead them to it. Lastly, we must recognize the small wins that they make along the steep path to victory. These celebratory acts will make the ultimate dream seem even closer, worth more and more risks we will ask them to take.
Notes
(1) One study found that students who received instructions suited to their dominant motivational focus were about 50% more likely than others to turn in their reports.
(2) Prevention-focused students were found to thrive with strategies emphasize rules and standards, and under leaders who tend toward micromanagement, discourage errors, and focus on effectively reaching more-immediate goals.
(3) In the world of nutrition, urban communities are often described as “food deserts”. I’d like to encourage today’s geography majors to map “dream deserts” and identify such as any geographic area with unjustly low opportunities for meaningful careers.
College Choice
College choice isn’t a decision students make at the end of senior year. Rather, its the many choices they make everyday on their way to and through college. Too often, students are making the wrong choices. This was the problem we discussed at a recent Data Jam hosted by Stanford University.
It seems absurd that we have smartphones to help us navigate our way to a destination, yet nothing to provide students with turn-by-turn directions to get them from where they are to where they want to be. What if we had a way to clearly show them where they’re headed should they continue in the same direction? What if we could also show them how to get back on track should they get lost?
Granted, the problems in public education are not easily solved, if the were we wouldn’t still be looking at them. I will be one of the first to acknowledge that not every student has an equal privilege of choice. I know all too well the very real reasons that some of my students could not “choose” to show up to first period.
The systems of power and privilege are inequitable, but this fact can’t substantiate a delay in giving students the right to use information that could help them make the right choices. Students must be given the power to access, understand and use their own academic data. Students must be given the right to see their own data. With their own academic data, a student could utilize tools that tell her the probability of attending a 2 year or 4 year college. Moreover, it could give her directions to improve her chances of getting to and through post-secondary graduation. These tools would help a student visualize where she is headed and what it would take to arrive at a different destiny-ation.
Student Rights in the Digital Age – The Right Choice
We need to upgrade the Students’ Rights Handbook. While the ACLU is rightly focused on a student’s right to privacy they aren’t fully articulating the equally important rights related to a student’s access to and control of his data. In February 2012, the White House issued a framework for protecting privacy and promoting innovation in the global digital economy, which clearly articulated guidance on what citizens should expect from those who handle their personal information, and set expectations for companies that use personal data. Rights related to access, transparency and control were of particular interest, and inspired me to appropriate the articles below:
Access: Consumers Students have a right to access their data in usable formats.
Individual Control: Consumers Students have a right to understand and exercise control over data that companies collect from them and how they use it.
Making the Right Choice
There are countless others committed to redefining the potential of our nation’s public education system. What if we came together to draft a blueprint for student rights in the digital age? Together we could will create a dynamic model that offers strong protections and enables ongoing innovation in new education technologies. When the U.S. Government released weather and GPS data to the public, it fueled an industry that today is valued at tens of billions of dollars. What if we gave students a right to their own data? What if innovators used that right as an opportunity to build a tool for students? And what if this tool told every student not only where they are, but how to get where they want to go?
An app won’t fix our nation’s inequitable public education system. Giving students the right to their own information, however, is a good step towards giving them the power to make the right choice.
